Power BI — NBA Through the Decades

Multi-page historical analysis of league evolution, player greatness, draft value, and team dynasties

Dashboard Overview

This four-page Power BI report explores 75+ years of NBA history through data. From the 3-point revolution and pace changes in "League Evolution," to all-time greats in "Player Greatness," draft pick value curves in "The Draft," and franchise dominance in "Team Dynasties" — each page tells a distinct story about how the game has transformed.

Data sourced from NBA/ABA/BAA Stats on Kaggle (sumitrodatta) — dataset version pulled Feb 6, 2026.

Dashboard walkthrough — interactive demo not available without Power BI Pro license. The full .pbix file is available upon request — feel free to reach out.
Player Greatness
Career Win Shares vs VORP, peak PER, all-time rankings
COMING SOON
The Draft
Pick value curves, bust/steal identification, college pipelines
COMING SOON
Team Dynasties
Rolling 5-year wins, net rating, franchise dominance
COMING SOON

Pages

  • League Evolution — Pace, PPG, and the 3-point revolution over time
  • Player Greatness — Career Win Shares vs VORP scatter, peak PER, all-time rankings
  • The Draft — Pick value curves, bust/steal identification, college pipelines
  • Team Dynasties — Rolling 5-year wins, net rating, franchise dominance

Key Insights

  • 3PA per game went from ~2 in 1980 to 35+ by 2024
  • Pace peaked in the 1960s (~120), bottomed in the early 2000s (~90), now ~100
  • After pick #5, average career Win Shares drop by ~50%
  • Only a handful of teams sustain 250+ wins over any 5-year window

Tools & Techniques

Power BI Desktop, DAX measures, Power Query (M), What-If parameters, bookmarks for era toggles, conditional formatting, scatter plots sized by career games, and range sliders for season filtering.

Data & Design

Built on historical NBA/ABA player, team, and draft data. Themed with NBA brand colors (#1D428A, #C8102E, #FDB927). Designed for storytelling — each page answers a specific question about how the game has changed.

Data Model

Star schema with 3 dimension tables (Dim_Seasons, Dim_Players, Dim_Leagues) connecting 10 fact tables covering player stats, team performance, draft history, awards, and shooting data.

Power BI data model view showing star schema with dimension and fact tables
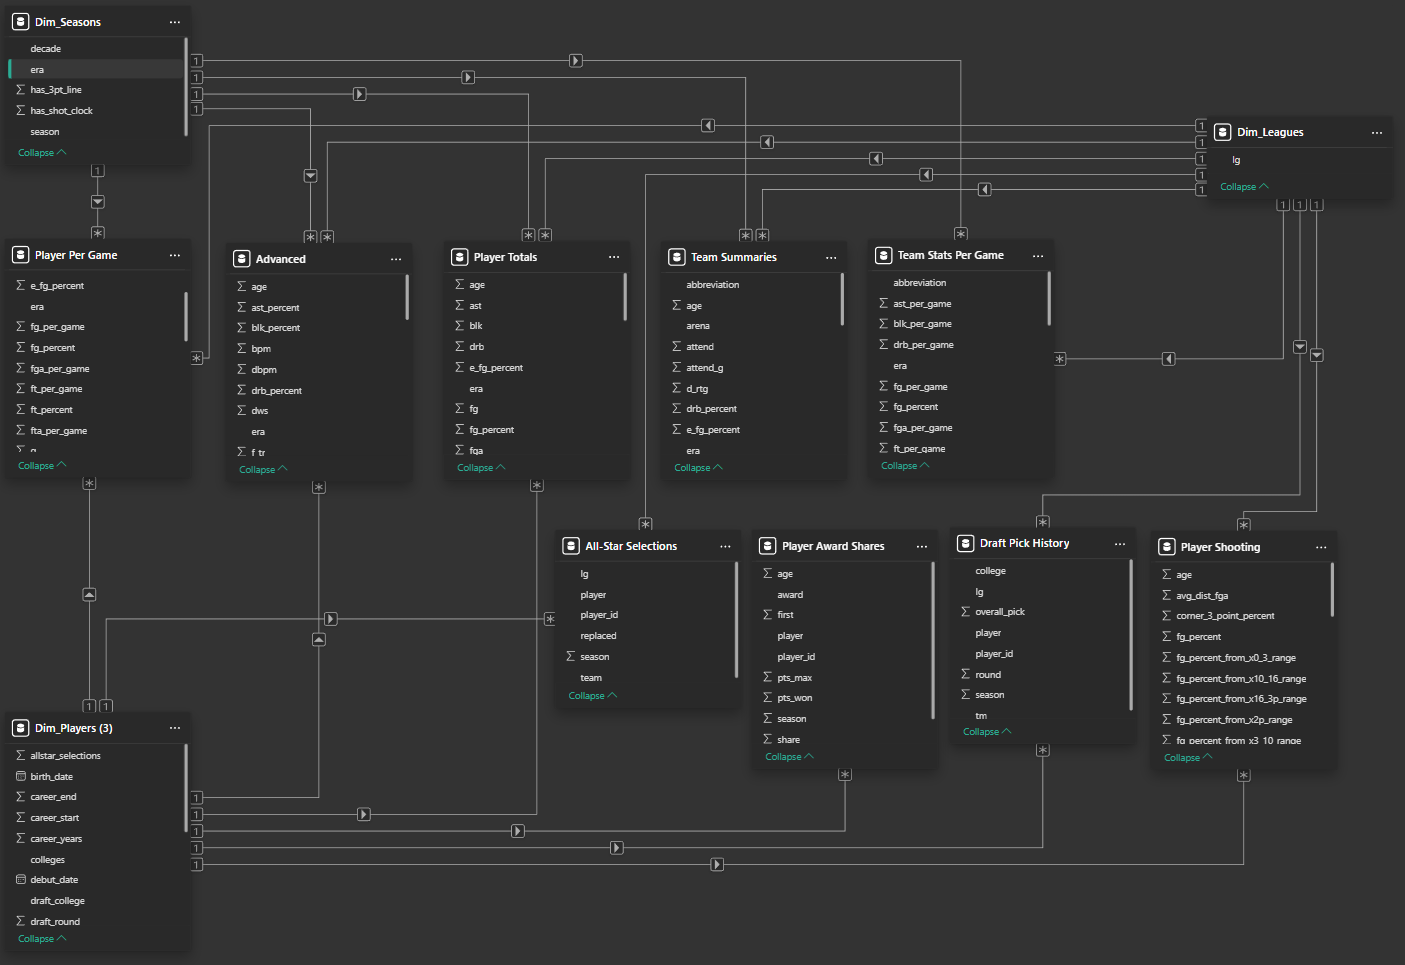
Power BI Model View — star schema with season, player, and league dimensions